Operating for Growth with One Key Metric
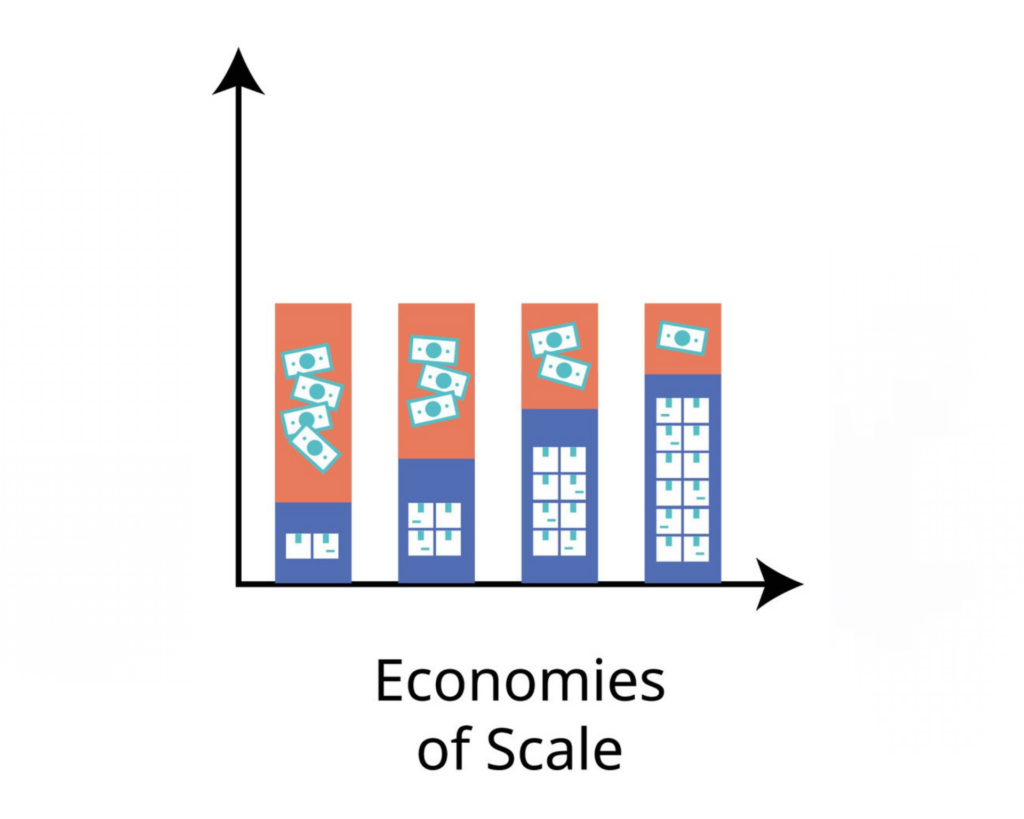
There is power in a singular focus. It’s the difference between a company that merely survives and one that thrives exponentially. When every facet of an organisation rallies behind one pivotal metric, the potential for transformative growth becomes not just a possibility but a reality. Operating for growth by concentrating on one defining metric isn’t a new concept, but it’s one that’s often overlooked in the quest for immediate gains and juggling multiple priorities. We often see entrepreneurs and startups doing too much too soon instead of growing and building upon the depth of one (or a few) key feature(s) that could be a game changer with growth. Over the past decade, I’ve witnessed firsthand the remarkable impact of this strategy. Leading a company through the dynamic landscapes of agro-trading and agro-processing, the commitment to one core metric became the cornerstone of our growth. This singular focus streamlined our operations and ignited a momentum that carried us through challenges and positioned us strongly in the market. The lessons learned through this journey underscore the profound difference that operating for growth with one key metric can make. THE ONE METRIC THAT MATTERS This metric I speak of isn’t just another number on a balance sheet. It is the embodiment of the value a company delivers to its customers. By honing in on this one pivotal measure, organisations can steer their strategies with precision, ensuring that every effort propels them closer to their vision of success. Global industry leaders have demonstrated the transformative power of this approach. Take Facebook, for instance. By focusing relentlessly on monthly active users, they didn’t just track a statistic; they also gauged the heartbeat of their platform’s community. This singular focus enabled them to tailor user experiences, drive engagement, and ultimately scale to unprecedented heights. Similarly, Airbnb zeroed in on nights booked. This metric allowed them to follow closely both supply and demand dynamics, guiding them to enhance host offerings and streamline guest experiences. This fuelled their rapid global expansion. This concept of a ‘North Star Metric’, as some call it, resonated deeply with me from the get-go. Witnessing how these giants channelled their resources and aligned their teams around one defining metric influenced my own strategic thinking. It became clear that to navigate the competitive terrains of agro-trading and agro-processing, my company needed a singular focal point through which the team would channel all our energies, a metric that would unify our purpose and drive every decision. THE POWER OF FOCUS IN ACTION When a company centres its attention on one critical metric, it creates a ripple effect that aligns every facet of the business. This singular focus becomes the lens through which all strategies are crafted and decisions are made. Operations streamline processes to support it; marketing tailors messages to amplify it; every department moves in unison towards a common goal. In practice, this alignment transforms the way a business operates daily. Decisions that once seemed complex become straightforward when measured against the guiding metric. If an initiative doesn’t contribute to enhancing that key figure, it’s set aside in favour of one that does. This clarity accelerates progress and minimises wasted effort. In my experience with Maxwell Investments Group, this approach proved invaluable. By prioritising volumes traded over other immediate gains, we reshaped our strategies to maximise throughput. Our procurement team focused on securing larger quantities of agricultural produce, knowing that increased volume would strengthen supplier relationships and improve bargaining power. The sales team concentrated on expanding our distribution networks to handle greater quantities, rather than chasing smaller, high-margin deals. This focus permeated every level of Maxwell Investments Group. Meetings became more productive as discussions centred on how to move many more millions of kilos more efficiently. Marketing efforts were designed to attract partners capable of handling or helping us handle substantial volumes. Even investments in infrastructure were guided by the question: “Will this enable us to trade more volume?” By aligning our operations around this one metric, we unlocked efficiencies that might have otherwise remained hidden. The entire company moved cohesively, each department’s efforts reinforcing the others. This synergy propelled our growth and fostered a culture of unity and purpose that drove us forward. CHOOSING THE RIGHT METRIC Selecting the right metric is paramount. It must encapsulate the core driver of growth specific to your industry. Not all metrics hold equal weight across different sectors. The challenge lies in identifying the one that will propel your business forward most effectively. This requires a deep understanding of the industry’s intricacies and what truly influences success within it. In sectors like agro-trading and agro-processing, volume often supersedes revenue or margins as the critical measure of growth. Why is this the case? Because these industries thrive on economies of scale. The more volume you handle, the more efficiently you can operate, reducing costs per unit and increasing competitiveness. Focusing on revenue alone can be misleading; high revenues don’t necessarily indicate sustainable growth if not backed by substantial volume. This realisation was a turning point for us at Maxwell Investments Group. We understood that prioritising the trading of millions of kilos per unit of time would yield greater long-term benefits than chasing immediate revenue spikes. By concentrating on volume, we could strengthen our supply chains, negotiate better terms with suppliers, and meet the demands of larger clients. This focus enabled us to scale efficiently, opening doors to markets that were previously beyond our reach. Choosing volume as our North Star Metric was more than just a strategic decision. It was a commitment to a growth trajectory that emphasised sustainability and scalability. It required a shift in perspective, recognising that the sheer quantity of goods moved in our industry would ultimately lead to more substantial margins and revenue growth over time. This decision has become the cornerstone of our success, demonstrating the profound impact of selecting the right metric to guide your business. THE CEO’S ROLE IN CHAMPIONING FOCUS The drive towards a singular metric begins at the top.
Operating for Growth with One Key Metric Read More »